I have come across with a request from multiple customers, from my colleagues and in multiple forums where if any agent stop collecting data, how we will be able to get that information?
I have developed a management pack for this request where I have used Kevin’s fragments.
How this Management pack works?
Well, in this management pack, I have used PowerShell probe action module to execute the PowerShell Script which will be running against the SCOM OperationsManager database server, and it will collect the required information. If we have got any data in the propertybag, this PowerShell script will log an error event 7890 on the Operations Manager event logs and it will have all the server details for which we have an issue with data collections.
This Monitor will run every 12 hrs., I have given the option to overrides the frequency however I would recommend running it only twice a day.
You can download the management pack from the below link.
Management-Packs/Custom.Perf.DataCollection.Verify.Monitor.xml at master · somahato/Management-Packs (github.com)
Please find the details about what you have to change to make this Management pack to work.
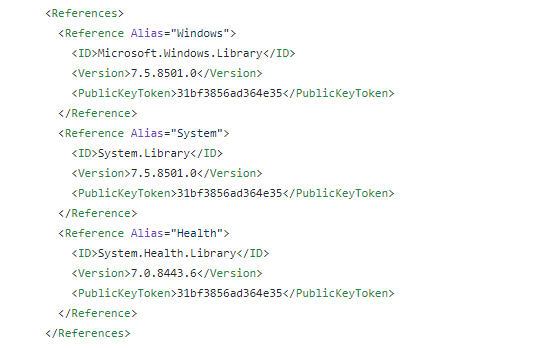
- Firstly, you have to change all the references in the MP according to the version of dependent MP in your environment. 

- Secondly, you need make changes in the XML in the Script body for the DatabaseName and Instance Name. If it is default instance name as MSSQLServer, please use the SQL server name. If it named instance, t should be like ‘sqlservername\instancename.

- You need to enable this Monitor only for the SQL server where OpeationsManager database is hosted. By default, this Monitor is disabled.
- Once MP is imported and enable it for the SQL server.
- Custom.PerfDataCollection.Verify.Monitor is the monitor that you need to enable through Authoring Pane.You could see the alert descriptions as following.
Custom PerfDataCollection Verify Monitor: detected a bad condition

Please run the below SQL query against the OperationsManager database to get the server details. Please also check event ID 7890 for more details.

select ME.Path As 'Name',
CAST(Max(TimeSampled) As nvarchar(50)) As 'LastSample',
CASE
-- The number 4 is the hour passed from last sample collection we wait before marking the server as BAD or OGOOD.
-- BAD should be for problematic servers
-- GOOD should be for working servers
WHEN Isnull(MAX(TimeSampled),'01-01-80') < DateAdd(hh,-4,getutcdate()) Then 'BAD'
Else 'GOOD'
END as 'Status'
from dbo.ManagedEntityGenericView ME
inner join dbo.ManagedTypeView MT on ME.MonitoringClassId=MT.Id
inner join dbo.PerformanceCounterView C on ME.Id = C.ManagedEntityId
left join dbo.PerformanceDataAllView P on C.PerformanceSourceInternalId=P.PerformanceSourceInternalId
where MT.Name like '%Linux%'
OR MT.Name like '%UNIX%' OR MT.Name like '%Windows%'

and ME.IsDeleted=0
group by ME.Path
order by Status
- You will get the servers details in the Operations manager log of the Management server under the event ID 7890 like below.
Log Name: Operations Manager
Source: Health Service Script
Date: 7/23/2021 11:40:02 PM
Event ID: 7890
Task Category: None
Level: Error
Keywords: Classic
User: N/A
Computer: Server.domain.com
Description:
Custom.PerfDataMonitor.ps1 :
Performance data is not collected for DC.domain.COM DC.domain.COM;DC
disclaimer
In this blog post, I have shared a possible solution for a problem that I encountered in my work. However, I want to make it clear that this solution is not officially supported by Microsoft, and it may have some risks or side effects that I am not aware of. Therefore, use this solution at your own discretion and responsibility.
